'%3e%3cg%20id='Group_60'%20data-name='Group%2060'%3e%3cpath%20id='Path_52'%20data-name='Path%2052'%20d='M73.9,28.453a6.189,6.189,0,1,0,6.189,6.189A6.188,6.188,0,0,0,73.9,28.453Z'%20fill='%230B1220'%3e%3c/path%3e%3cpath%20id='Path_53'%20data-name='Path%2053'%20d='M73.9,50.669a6.189,6.189,0,1,0,6.189,6.189A6.188,6.188,0,0,0,73.9,50.669Z'%20fill='%230B1220'%3e%3c/path%3e%3cpath%20id='Path_54'%20data-name='Path%2054'%20d='M112.154,28.453H89.723A6.045,6.045,0,0,0,83.678,34.5v.284a6.047,6.047,0,0,0,6.047,6.047h8.242a4.919,4.919,0,0,1,0,9.839H89.974a6.3,6.3,0,0,0-6.3,6.3,6.08,6.08,0,0,0,6.08,6.08h22.4a.076.076,0,0,0,.076-.076V28.53A.077.077,0,0,0,112.154,28.453Z'%20fill='%230B1220'%3e%3c/path%3e%3c/g%3e%3crect%20id='Rectangle_131'%20data-name='Rectangle%20131'%20width='6.783'%20height='34.744'%20transform='translate(118.344%2028.254)'%20fill='%230B1220'%3e%3c/rect%3e%3cpath%20id='Path_55'%20data-name='Path%2055'%20d='M141.543,28.255H128.074V63h6.783V49.921h6.686c7.173,0,11.467-4.929,11.467-10.834s-4.294-10.832-11.467-10.832M141.2,43.82h-6.344V34.305H141.2c3.074,0,5.026,1.951,5.026,4.782s-1.952,4.733-5.026,4.733'%20fill='%230B1220'%3e%3c/path%3e%3cpath%20id='Path_56'%20data-name='Path%2056'%20d='M167.683,28.255A12.787,12.787,0,0,0,158.264,32c-3.513,3.454-3.416,7.725-3.416,13.627s-.1,10.175,3.416,13.63a13.662,13.662,0,0,0,18.788,0c3.514-3.455,3.464-7.727,3.464-13.63s.05-10.173-3.464-13.627a12.674,12.674,0,0,0-9.369-3.744m4.342,26.75a5.675,5.675,0,0,1-4.342,1.828,5.786,5.786,0,0,1-4.392-1.828c-1.318-1.444-1.66-3.032-1.66-9.625s.342-8.181,1.66-9.623a5.78,5.78,0,0,1,4.392-1.829,5.669,5.669,0,0,1,4.342,1.829c1.318,1.442,1.708,3.032,1.708,9.623s-.39,8.181-1.708,9.625'%20fill='%230B1220'%3e%3c/path%3e%3cpath%20id='Path_57'%20data-name='Path%2057'%20d='M206.183,34.305V28.255H183.3V63h22.886V56.948h-16.1V48.5h13.713V42.454H190.079V34.305Z'%20fill='%230B1220'%3e%3c/path%3e%3c/g%3e%3c/svg%3e)
Baza wiedzy · Case study · Przemysł
Multon: 15 minutes of downtime instead of 4.5 hours a day
IPOE monitoring and the team's PDCA work supported improvements on a packaging line. In the comparison presented, downtime fell by 94.4% and daily output rose by 15.3%.
IPOE Team · 9.09.2026
A production line guided by data
At the Multon plant, horticultural soil is packed into 50-litre bags. One line, three shifts and hundreds of pallets a day — in a process like this, every hour of standstill cuts into production capacity. The team needed data that would help compare the shifts and point to the areas that required improvement.
Starting point
In the figures recorded before the deployment, downtime reached 4.5 hours a day. The three shifts produced 169, 163 and 144 pallets. That came to 476 pallets a day, with a 25-pallet gap between the best and the weakest shift.
Without current insight into the data, it was hard to connect production results with how the line actually ran, or to establish where a change was needed.
What was deployed
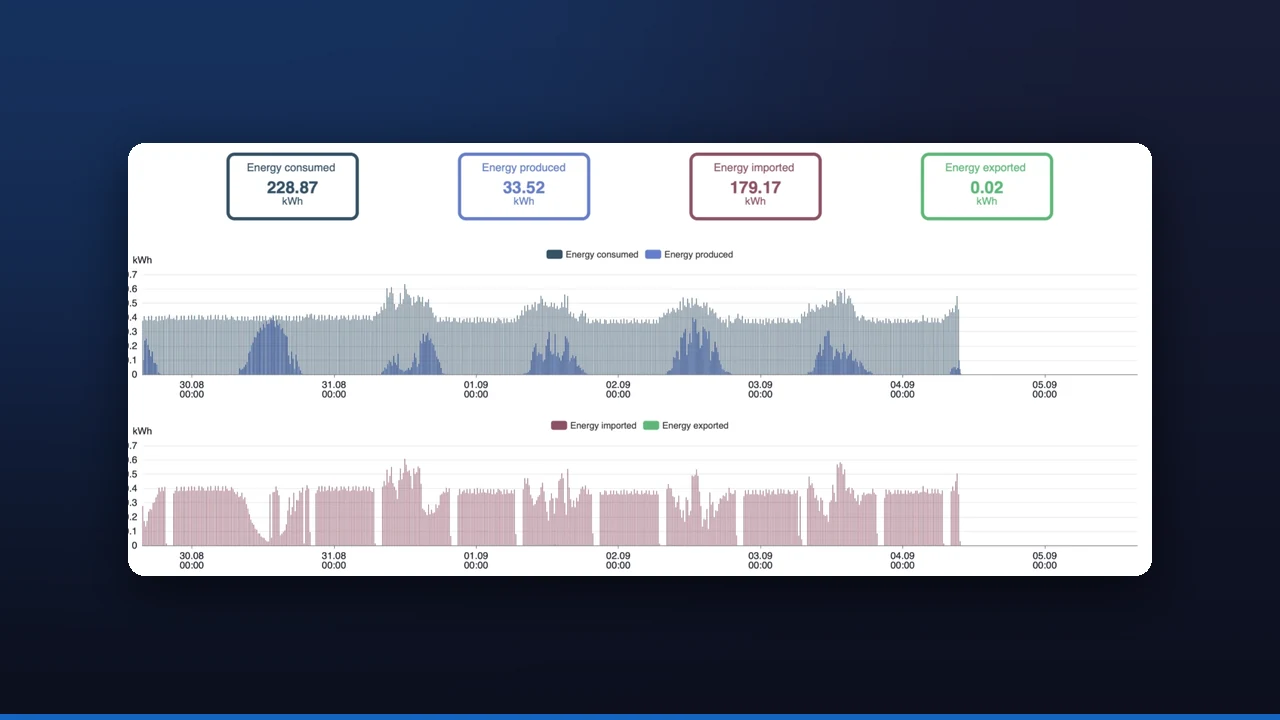
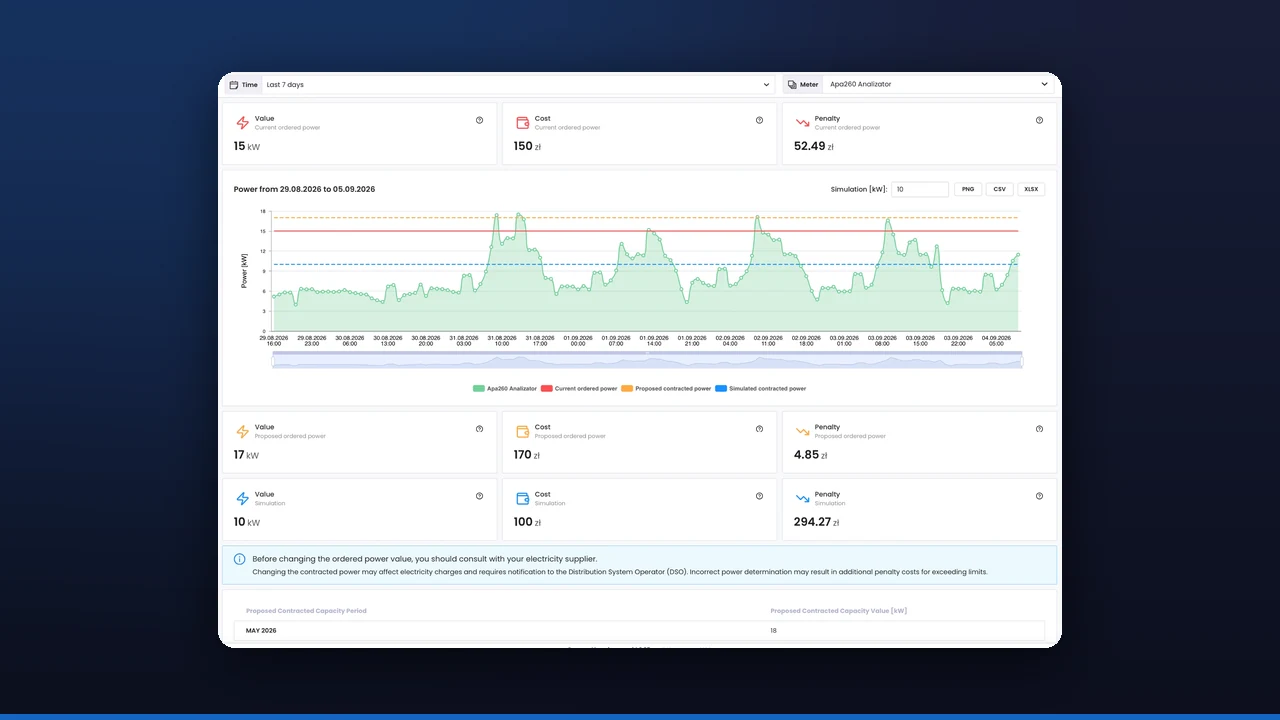
The IPOE platform brought the production line under monitoring. Live data and energy consumption reports — prepared after every shift and once a day in summary — gave the team a shared basis for analysis.
The team worked in a PDCA cycle: planning improvements, introducing them, checking the results and correcting the next steps. IPOE supported that process with measurements and reporting; the improvement also came from the people working on how production was organised.
Results in the comparison presented
| Indicator | Before | After |
|---|---|---|
| Downtime per day | 270 minutes | 15 minutes |
| Daily output | 476 pallets | 549 pallets |
| Average output per shift | about 159 pallets | 183 pallets |
Downtime was reduced by 255 minutes a day, or 94.4%. Daily output rose by 73 pallets — 15.3%. The deployment record also notes that results across the shifts became more even.
What changed in running the line
Regular reports let the team analyse the process on a shared basis and check the outcome of each improvement. The data became part of everyday work on reducing downtime and keeping production stable.
The figures shown relate to a before-and-after comparison for this deployment and the team's work around it. They do not represent a guaranteed result for another production line.
Let's talk about your line
Want to see when your line loses production time? Talk to an IPOE engineer about monitoring and reporting for your plant.